
- This event has passed.
Charting the UK Powergrid
17/08/2017 @ 7:30 pm - 11:00 pm

“More power!” is an often used phrase in various space Sci-Fi series, as are various comments about ‘bypassed like a Christmas tree’ and “This jurry-rigging won’t last for long!…”. And so we have the local power grid from Newcastle upon Tyne from the early days of 1901 much expanded into what we now have as the UK National Grid.
More recently, near-real-time data for the electricity power generation is available to follow the ebb and flow of the UK energy usage and from that to infer the energy wastage, and also the CO2 and other pollution consequently generated. Some of this is already being charted on the website Gridwatch UK.
Herewith is my take on the available data to chart the UK National Grid using Munin and RRD, with multiple views of the data to see something of the daily power flows.
For a guaranteed electrifying experience! 🙂

All at our usual favored Angel Microbrewery 7:30pm Thursday 17/08/2017.
(Some of us will be there early for food before the meeting proper.)
All welcome!
We have the large table in the brewing room. Just look for the Linux and Penguins and occasional octarine sparks 🙂
Cheers,
Martin
For a preview (‘work-in-progress’) small sample for a goodly bright and breezy mix of power (15:00BST 19/08/2017):
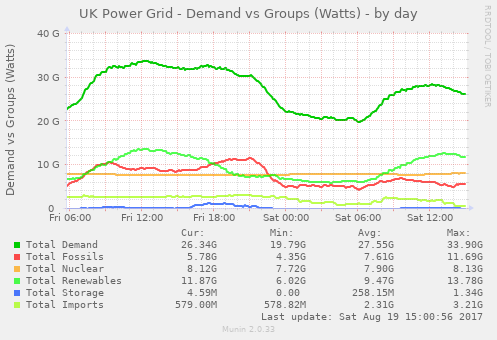
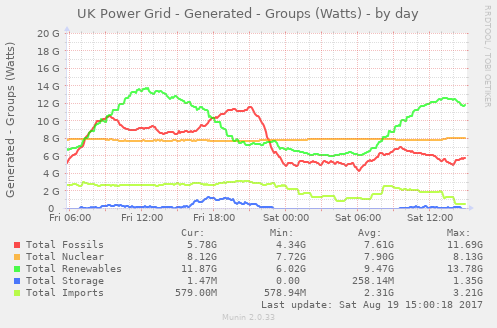
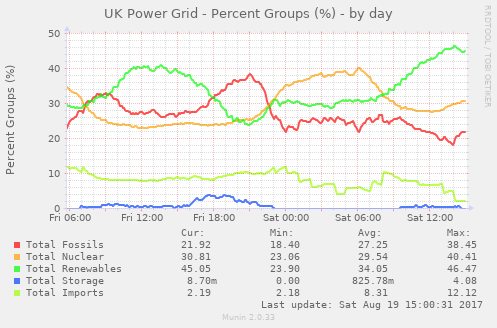
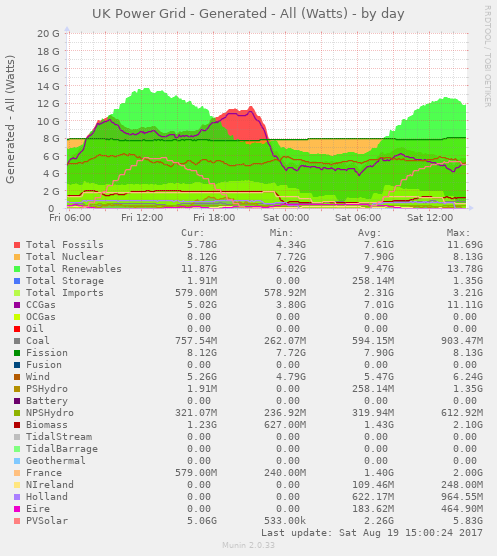
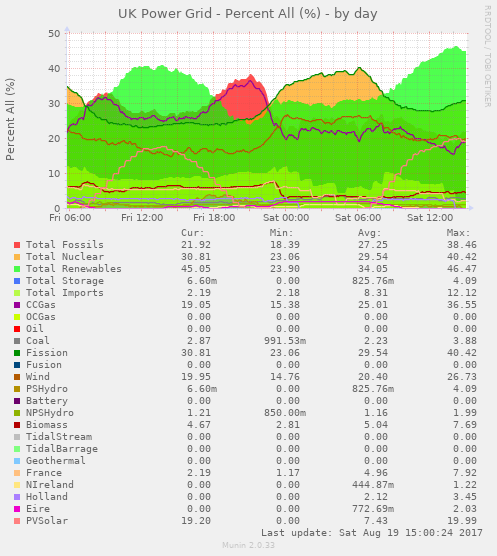
Note that normally during the week, power from Combined Cycle Gas Turbines dominates. With lower demand at the weekends, the renewables can dominate. More green power means less pollution…
The charting is a WIP to be updated…

Leave a Reply
You must be logged in to post a comment.